1. Match the phrases in the box with the graphs (a-f). (Khớp cụm từ trong hộp với đồ thị (a-f).)
| a. rise/increase steadily | b. fall/decrease sharply | c. stay the same/remain stable/level off |
| d. fluctuate | e. rise/increase sharply | f. fall/decrease steadily |
2. Rewrite the sentences without changing their meaning. (Viết lại câu mà không làm thay đổi nghĩa của chúng.)
1. There has been a dramatic rise in the migration of young people to big cities.
2. Due to shortages of jobs, the population in rural areas has decreased in the last 10 years.
3. There was an increase of over 30% in the urbanisation rate in Indonesia from 1969 to 2009.
4. The rate of urbanisation in South Korea rose sharply during the period between 1969 and 7989.
5. There was a slight decrease in the urbanisation rate in this city during the economic crisis in 2008.
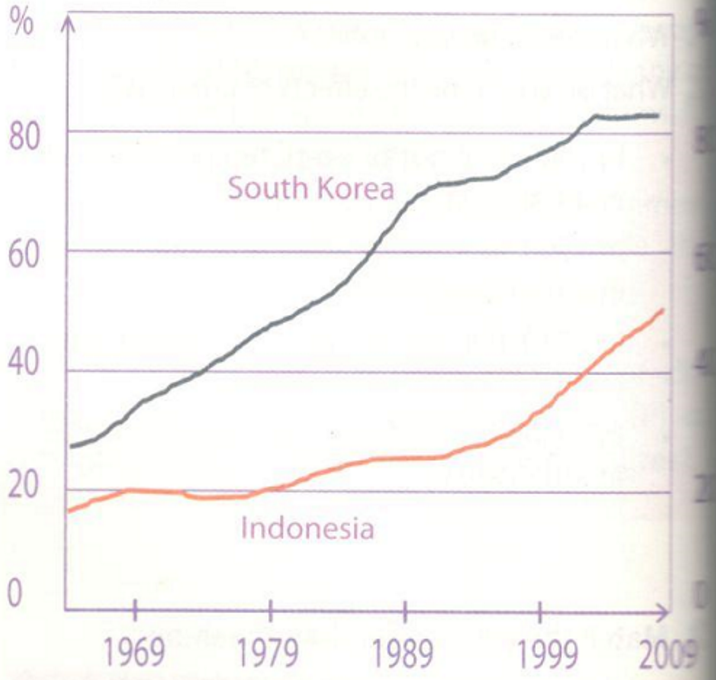
3. The line graph below shows the urbanisation rate in South Korea and Indonesia. Write a description (of about 150 words) of the trends in the graph. (Đường đồ thị dưới đây cho thấy tỷ lệ đô thị hóa ở Hàn Quốc và Indonesia. Viết mô tả (khoảng 150 từ) về các xu hướng của đồ thị.)

The line graph shows the rate of urbanisation in two countries, namely Indonesia and South Korea, from the mid-1960s to 2009.
In the mid-1960s, the rate of urbanisation in Indonesia was about 17%, followed by a slight increase of 3% in 1969. Then the rate remained stable at around 20% for a ten-year period from 1969 to 1979. In the next fifteen years, there was a steady rise in the rate of urbanisation in this country. From 1995 to 2009, Indonesia's urbanisation rate increased sharply, reaching over 50%.
South Korea's urbanisation rate was about 30% in 1969, roughly 10% higher than that of Indonesia. The rate went up sharply throughout the next thirty-year period to about 82% in 2005, and then levelled off towards 2009.
In conclusion, it is clear that while both countries experienced a growth in their urbanisation rate, in South Korea it almost doubled by the end of the period.